
How Much Energy Can a Solar Panel Produce? (2026 Guide)
Solar panels don’t all produce the same amount of power, and the number quoted on a spec sheet rarely matches what shows up on an electric bill. A panel’s actual output depends on its wattage, the amount of usable sunlight it receives, the angle it’s mounted at, the local climate, and a handful of real-world losses that most calculators skip over. This guide walks through exactly how much energy a solar panel produces on a daily, monthly, and yearly basis, and shows you how to calculate the number for your own roof.

Table of Contents
- Watts, Watt-Hours, and Kilowatt-Hours: The Basics
- How Much Energy Does One Solar Panel Produce Per Day?
- Daily Output by Panel Wattage
- Monthly and Annual Solar Panel Output
- How Location Changes Everything
- How Many Solar Panels Does a House Need?
- Output by Full System Size (3kW–10kW)
- What Reduces Real-World Solar Output
- Seasonal Swings in Solar Production
- How to Calculate Your Own Panel’s Output
- Does Panel Efficiency Matter?
- How Output Changes as Panels Age
- Frequently Asked Questions
- Key Takeaways
Watts, Watt-Hours, and Kilowatt-Hours: The Basics
Before any output number makes sense, it helps to separate two things that get mixed up constantly: power and energy.
- Watts (W) measure power — the rate at which a panel is generating electricity at a single moment. A “400W panel” is rated to put out 400 watts under laboratory test conditions (full, direct sunlight, a cell temperature of 25°C/77°F, and no shading).
- Watt-hours (Wh) and kilowatt-hours (kWh) measure energy — power multiplied by time. A 400W panel running at full output for one hour produces 400 Wh, or 0.4 kWh.
Because sunlight isn’t constant throughout the day, panels rarely run at their full rated wattage for very long. That’s where the idea of peak sun hours comes in.
Peak sun hours are not the same as daylight hours. They represent the number of hours per day during which sunlight intensity averages 1,000 watts per square meter — the benchmark used to rate panels. A location might get 14 hours of daylight but only 5 “peak” hours of sunlight strong enough to count at full intensity. Most of the U.S. averages somewhere between 3 and 6.5 peak sun hours a day, depending on climate and season.
How Much Energy Does One Solar Panel Produce Per Day?
The basic formula solar installers and tools like NREL’s PVWatts calculator use is:
Panel Wattage (kW) × Peak Sun Hours × System Derate Factor = Daily Energy Output (kWh)
The derate factor accounts for real-world losses — inverter conversion, wiring resistance, dust, mismatch between panels, and general system inefficiency. Most professional estimates use a derate factor around 0.80–0.86, meaning a system typically delivers 80–86% of its theoretical maximum.
Most residential panels installed today are rated between 350 and 450 watts, with 400W being the most common reference point. Using a 400W panel as the example:
- At 4 peak sun hours (a cloudier, northern climate): roughly 1.3–1.6 kWh per day
- At 5 peak sun hours (the U.S. residential median): roughly 1.6–1.9 kWh per day
- At 6+ peak sun hours (a sunny southwestern location): roughly 2.0–2.4 kWh per day
So, as a rule of thumb, a single modern residential solar panel produces somewhere between 1.2 and 2.5 kWh per day, with most homes landing close to the middle of that range.
Daily Output by Panel Wattage
Here’s how daily output scales across common panel sizes at 5 peak sun hours (a reasonable national average) using an 0.83 derate factor:
| Panel Wattage | Approx. Daily Output | Approx. Monthly Output | Approx. Annual Output |
|---|---|---|---|
| 100 W | ~0.4 kWh | ~12 kWh | ~150 kWh |
| 250 W | ~1.0 kWh | ~30 kWh | ~380 kWh |
| 300 W | ~1.25 kWh | ~38 kWh | ~455 kWh |
| 350 W | ~1.45 kWh | ~44 kWh | ~530 kWh |
| 400 W | ~1.65 kWh | ~50 kWh | ~605 kWh |
| 450 W | ~1.9 kWh | ~57 kWh | ~685 kWh |
| 550 W (large commercial-style panel) | ~2.3 kWh | ~70 kWh | ~835 kWh |
If you’re specifically weighing a 400 watt solar panel for your setup, its real-world daily output typically lands close to the 1.6–1.9 kWh range shown above, making it one of the most balanced choices for standard residential roofs.
These figures assume average conditions. A panel in Phoenix with 6.5 peak sun hours will produce noticeably more than the same panel in Seattle with closer to 4 peak sun hours — sometimes a 40–50% difference for identical hardware.
Monthly and Annual Solar Panel Output
Multiplying the daily figure by roughly 30.4 days gives a monthly estimate, and multiplying by 365 gives an annual one — but real production isn’t flat across the year (more on that in the seasonal section below). As a planning number, most single 400W residential panels produce somewhere in the 500–700 kWh per year range, depending entirely on local sun exposure and system losses.
Solar professionals often express this as specific yield — kWh produced per kWp (kilowatt-peak) of installed capacity per year. Globally, specific yield typically falls between 1,000 and 2,000 kWh/kWp/year, with sunnier, drier climates landing at the higher end and cloudier, higher-latitude regions at the lower end.
How Location Changes Everything
Peak sun hours vary dramatically by geography, and that variation matters more than almost any other single factor. Approximate average peak sun hours for a few U.S. metro areas:
| City | Approx. Peak Sun Hours/Day | Daily Output (400W panel) |
|---|---|---|
| Phoenix, AZ | ~6.5 | ~2.2 kWh |
| Los Angeles, CA | ~5.8 | ~1.9 kWh |
| Austin, TX | ~5.5 | ~1.8 kWh |
| Boston, MA | ~4.5 | ~1.55 kWh |
| Seattle, WA | ~4.0 | ~1.3 kWh |
| Anchorage, AK | ~3.2 | ~1.05 kWh |
The same exact panel, installed on two rooftops in different states, can produce close to double the electricity in one location versus another — which is why any “average” figure quoted online should be treated as a starting point, not a guarantee.
How Many Solar Panels Does a House Need?
The average U.S. household uses somewhere around 850–900 kWh of electricity per month, according to EIA data. Working backward from the daily output figures above:
- At ~1.6 kWh/day per 400W panel, one panel produces roughly 48 kWh/month.
- To cover 900 kWh of monthly usage, that works out to roughly 18–20 panels under average sun conditions.
Most residential solar installations in the U.S. today fall somewhere between 12 and 25 panels, translating to system sizes of roughly 5–10 kW, depending on the home’s energy use, roof space, and local sunlight.
Output by Full System Size (3kW–10kW)
Rather than sizing panel by panel, most homeowners think in terms of total system capacity. Approximate annual output at average U.S. sun conditions:
| System Size | Approx. Annual Output |
|---|---|
| 3 kW | ~3,800–4,200 kWh |
| 4 kW | ~5,000–5,600 kWh |
| 5 kW | ~6,300–7,000 kWh |
| 6 kW | ~7,600–8,400 kWh |
| 8 kW | ~10,000–11,200 kWh |
| 10 kW | ~12,700–14,000 kWh |
A 5–6 kW system is the most common residential size and, in an average-sun location, comes close to offsetting a typical household’s full annual electricity use.
What Reduces Real-World Solar Output
The wattage printed on a panel is a lab number. Several factors chip away at it once the panel is actually installed:
- Temperature. Solar cells lose efficiency as they heat up. Panels typically lose about 0.3–0.5% of output for every degree Celsius above 25°C, which means a panel baking on a hot summer roof can underperform its rating even in bright sun.
- Shading. Even partial shade on one section of a panel — from a chimney, tree branch, or nearby building — can disproportionately reduce output across the whole panel or string, depending on the wiring.
- Inverter losses. Converting the DC electricity panels produce into the AC electricity homes use typically costs 2–5% of total energy.
- Dust, dirt, and soiling. Panels that go uncleaned for long stretches, especially in dry or dusty climates, can lose several percent of output.
- Tilt and orientation. A panel mounted at the wrong angle or facing away from true south (in the Northern Hemisphere) captures less usable sunlight over the course of a year.
- Wiring and mismatch losses. Resistance in cabling and slight performance differences between panels in the same array add up to a small but real loss.
Combined, these factors are why professional solar estimates apply a derate factor of roughly 80–86% to the theoretical maximum — the gap between “nameplate wattage” and “what actually reaches the meter.”
Seasonal Swings in Solar Production
Output isn’t constant throughout the year. In most of the U.S., solar systems generate the most electricity from April through September, when days are longer and the sun sits higher in the sky, and the least from November through February. It’s not unusual for a system’s best month to produce two to three times more energy than its worst month, even though the panels themselves haven’t changed at all. Anyone sizing a system around a single month’s output is likely to be surprised by winter production — annual totals are a far more reliable planning number than any single month.
How to Calculate Your Own Panel’s Output
To get a working estimate for a specific panel or roof:
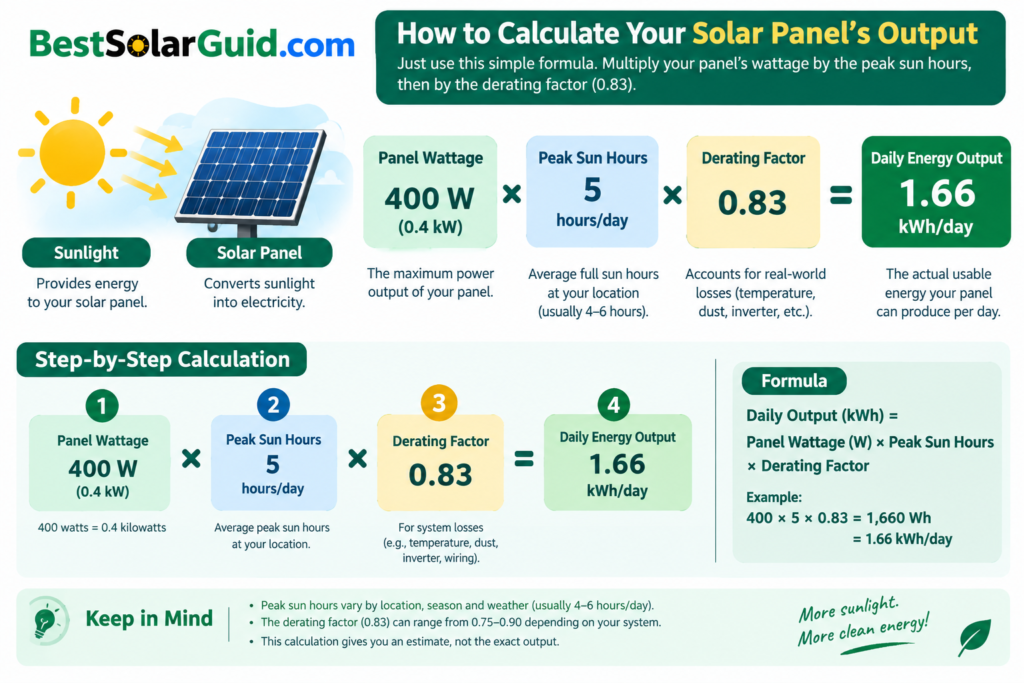
- Find the panel’s rated wattage, usually printed on the panel or listed in its datasheet (for example, 400 W).
- Look up peak sun hours for your location. National solar maps or NREL’s PVWatts tool provide reasonably accurate regional averages.
- Multiply wattage (in kW) by peak sun hours to get the theoretical daily output.
- Apply a derate factor of about 0.80–0.86 to account for real-world system losses.
- Multiply by 30 for a monthly estimate, or 365 for an annual one, keeping in mind seasonal variation will shift the actual monthly numbers up or down.
For a more precise, location-specific estimate that accounts for your exact roof tilt, orientation, and shading, NREL’s free PVWatts calculator is the tool most solar professionals rely on.
Does Panel Efficiency Matter?
Panel efficiency — the percentage of sunlight hitting a panel that gets converted into usable electricity — typically ranges from about 15% to 22% for standard residential panels, with premium models reaching into the low-to-mid 20s. A higher-efficiency panel produces more power from the same physical size, which matters most when roof space is limited. If roof space isn’t a constraint, total system wattage matters more than squeezing extra efficiency out of each individual panel, since two systems with the same total capacity will produce similar amounts of electricity regardless of how many panels it took to get there.
This is also why the right panel size often depends on the type of installation — for a closer look at how output and design priorities shift between setups, see our guide on commercial vs residential solar panels.
How Output Changes as Panels Age
Solar panels degrade slowly over time rather than failing outright. Most manufacturers warranty a degradation rate of roughly 0.3–0.5% of output lost per year, meaning a panel is typically still producing 85–92% of its original output after 25 years. This slow decline is factored into manufacturer warranties, which commonly guarantee a minimum performance level (often around 85–87% of original output) at the 25-year mark.
Frequently Asked Questions
Do solar panels produce energy on cloudy days?
Yes, though at reduced output. Panels use light, not heat, so they continue generating electricity in overcast conditions — typically somewhere between 10% and 25% of clear-day output, depending on cloud density.
Is a higher-wattage panel always better?
Not necessarily. A higher-wattage panel produces more electricity from the same roof space, but it may also cost more per panel. The right choice depends on available roof area, budget, and cost per watt rather than wattage alone.
How much energy does one solar panel produce in a year?
For a typical modern 400W residential panel under average U.S. sun conditions, annual output generally falls between 500 and 700 kWh, with meaningful variation based on location.
Can one solar panel power a whole house?
No. A single panel only covers a small fraction of typical household consumption. Most U.S. homes need a full system of 12–25 panels to meaningfully offset their electricity use.
Why does my system produce less than the “rated” output suggests?
Because rated wattage is measured under ideal lab conditions. Real-world factors — temperature, shading, dust, inverter losses, and off-angle mounting — typically bring actual output down to 80–86% of the theoretical maximum.
Key Takeaways
- Panels degrade slowly, losing about 0.3–0.5% of output per year, and still perform well after 25+ years.
- A single modern residential solar panel (350–450W) typically produces 1.2 to 2.5 kWh per day, depending mostly on location and sun hours.
- Peak sun hours, not total daylight hours, are the number that actually determines output.
- Real-world systems lose roughly 14–20% of their theoretical maximum output to temperature, shading, wiring, and inverter losses.
- Most U.S. homes need a 5–10 kW system (roughly 12–25 panels) to substantially offset their electricity use.
- Output swings seasonally, with spring and summer producing far more than fall and winter — annual totals matter more than any single month.